
CBT 2017 Conferences Readership Profiles: Key Metrics (Source: Google Analytics)
A statistical representation of global users for cognitivebehavioraltherapy.conferenceseries.com(Source: Google Analytics)
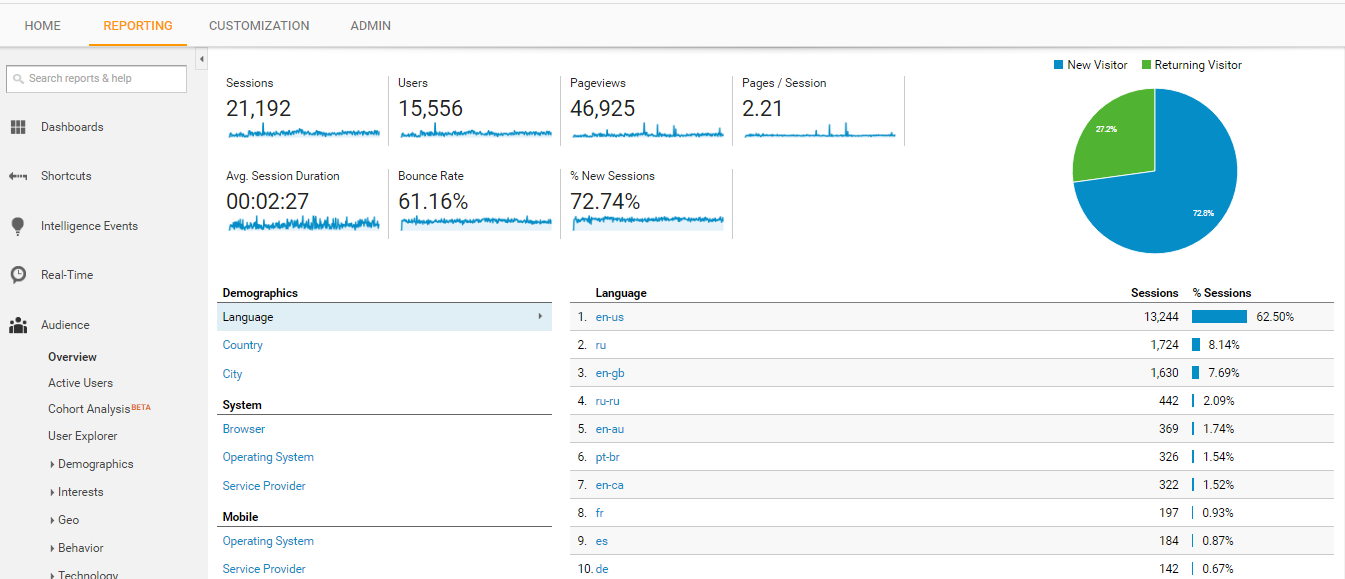
CBT 2017 Google Analytics Metrics: At Glimpse
More than 46,925 Visitors who analysed our conference website to attend and submit proposals of their research work.
- Highest number of Visitors reported from both, the developed and developing nations
- Majority of the visitors have come from 10 countries/territories which includes USA, United Kingdom, Russia, Canada, Australia, Germany, France, Brazil, Japan, China, South Korea, Austria and India.
- Penetrating the study of visitor, navigation, and traffic patterns to determine the success of our conference website majority amount of traffic we receive from cities like New York, London, Sydney, Paris, Frankfurt, Tokyo, Moscow and Vienna.
- Average Time spent by each visitor on our Site is 2.27 Minutes
The Traffic Sources mentions that the number of Unique Visitors of the website listing from renowned universities, research institutions and organizations
Reasons behind listing Psychiatry on top of search engines: (Source: Google)
- Researchers are inclined only to the conferences where their profiles and abstracts get highest visibility and readership.
- The most accessible way for researchers to grow their research profiles is through their contributions with a conference presentation at our conference.
- Our Conference provides opportunities to network and meet other researchers in their field and establish potential contacts for future positions.
- Attending and presenting at our conference would contribute to learn about the most recent advances in their field.
- Get an opportunity to publish full paper in our international journals with high impact factors on Special issues.
Besides all these factors we also create individual speaker pages where their accepted biographies and abstracts are updated on regular basis for promoting their web presence in all the search engine listings and Social Networking Channels.
The dashboard of Google Analytics traffic overview of “17th Global Summit on Cognitive, Psychological and Behavioral Sciences” reflects the interaction of the global conference attendees like Neurologists, Psychiatrist, Academicians, Practitioners, Early Career Scholars, Students along with Industries, Organizations and other key stake holders from Psychiatry and Medicine space who are in search to attend and present/exhibit their research findings on highly acknowledged conferences like CBT 2017 with the web traffic a total of 15,556 viewers.
The total views of our website were 46,925 where our reports are analysed quarterly.
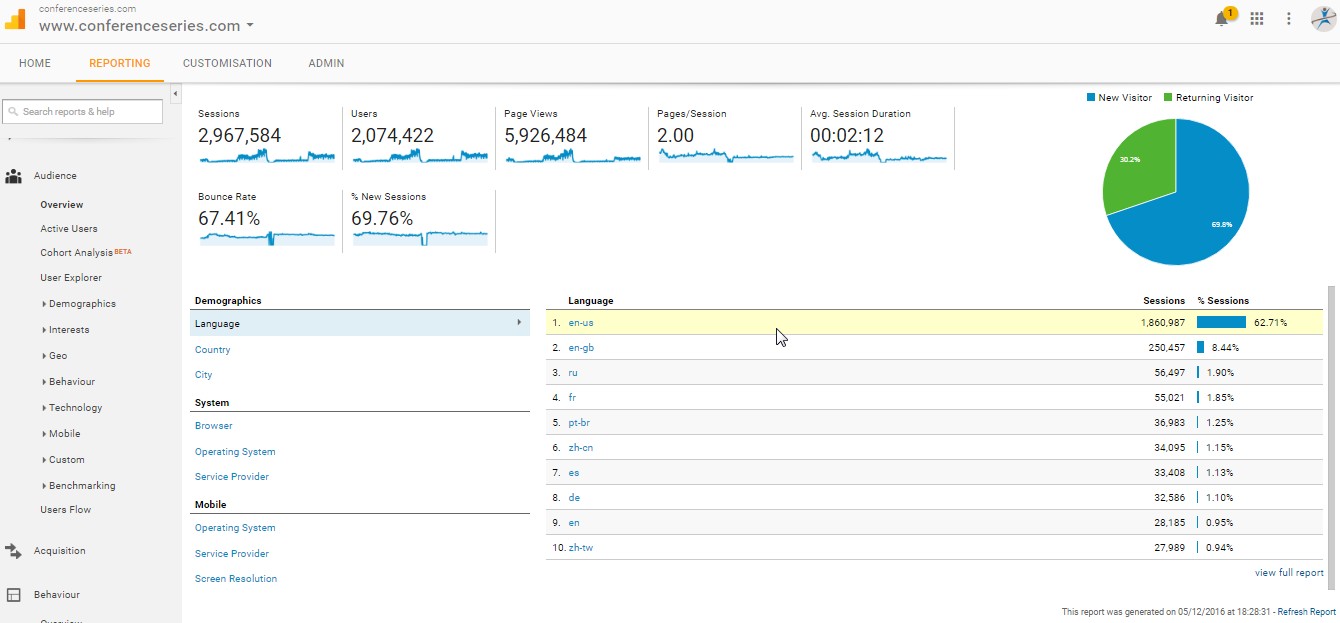
Global Internet users for conferenceseries.com: Statistical representation (Source: Google Analytics)
Flip on the other side Conferenceseries world’s leading specialist in organizing scientific conferences, events trade, and consumer exhibitions both domestically and internationally in different verticals and horizontals like Medical, Pharma, Engineering, Science, Technology and Business attracting more than 25 Million+ Visitors, 25000+ unique visitors per conference and 70000+ page views for every individual conference would help in quantifying our presenters research and biography visibility to the online communities and get recognized worldwide.
Conference Series Web Metrics at Glance: Source: Google Analytics
- 25 Million+ Visitors
- 25000+ unique visitors per conference
- 70000+ page views for every individual conference
Out of the 500,000 listing worldwide major conferences attended by 2.5 million attendees 16.8% attendees are drawing only from our Medical, Pharma, Healthcare, Nursing, Engineering, Science, Technology and Business conferences. The main reasons behind the increased popularity of our conference attendees is because of the changing mindsets of academicians, researchers and industries in exploring the opportunities for exchanging ideas, sharing resources, building networks and increase awareness of the on the recent happenings in their research around the world.
“Attending and presenting at conferences remains as the most favorable model of knowledge dissemination for researchers and practitioners to keep abreast of all advances in their field, presenting state-of-the-art research usually on a variety of subjects”
We will continue to set our bar higher and make further progress to organize 1000 conferences in 50 countries across all continents by 2018. We have recently launched online digital video library where all our conference proceedings would be shared and be accessed by the online communities freely.
Channels for driving additional traffic to your research
Web Analytics are best means of measuring concrete details like how many people are visiting our websites, how many of those visitors are the unique visitors and how many of them are staying long to view the complete information available in our sites. The following snapshots of some of our websites will clearly depict the metrics how our conferences stand at par to the other conferences in terms of Visibility, outreach, Participation Number and relevance to their subject.
The metrics of these websites represents more than 25+ Million visitors in addition to this we also equipped with 10 additional scientific websites represents 10+ Million visitors traffic to our conference websites.
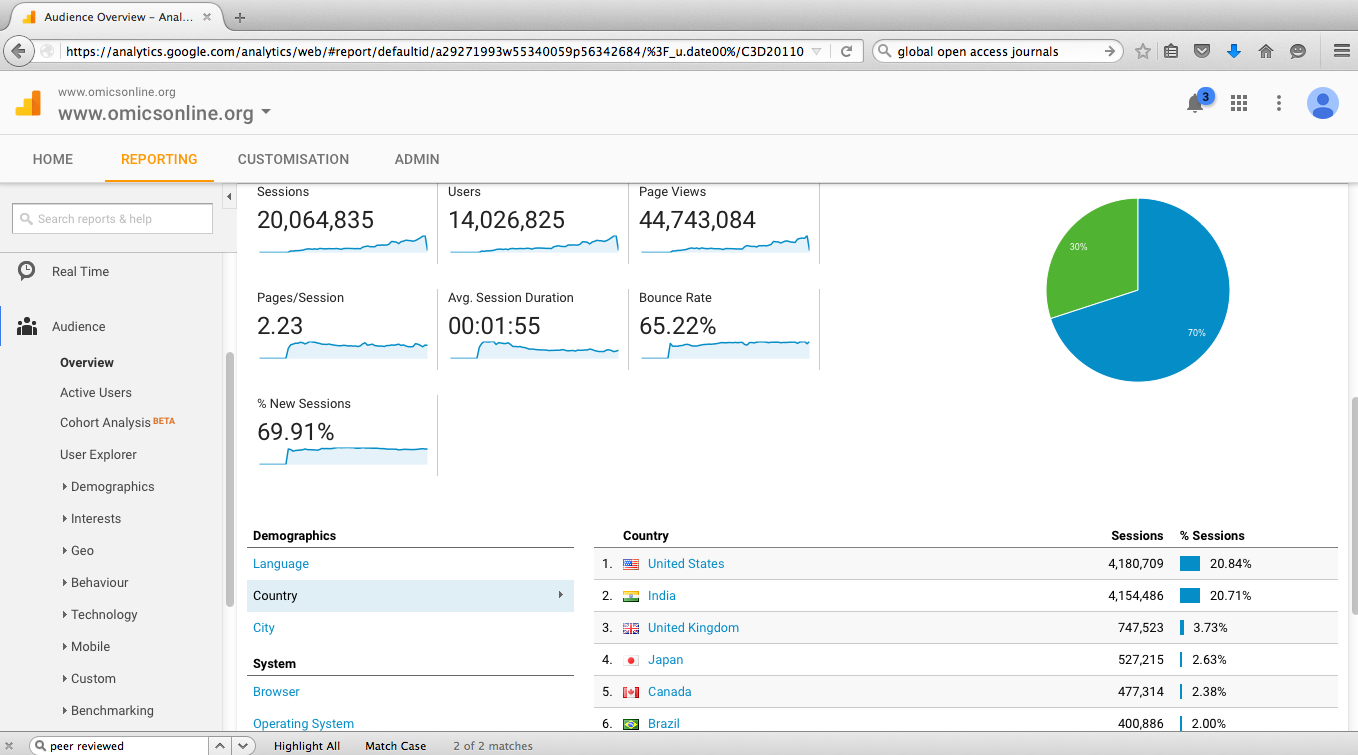
A statistical representation of global users for www.omicsonline.org (Source: Google Analytics)
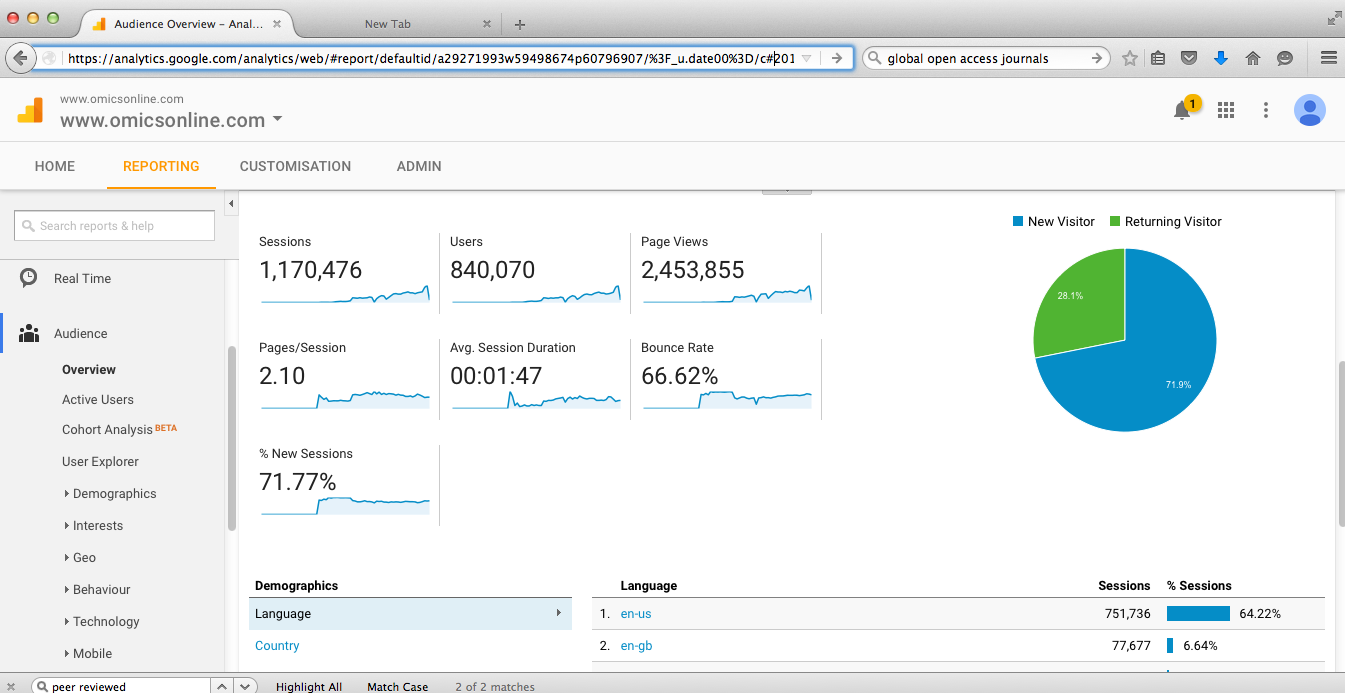
A statistical representation of global users for www.omicsonline.com (Source: Google Analytics)
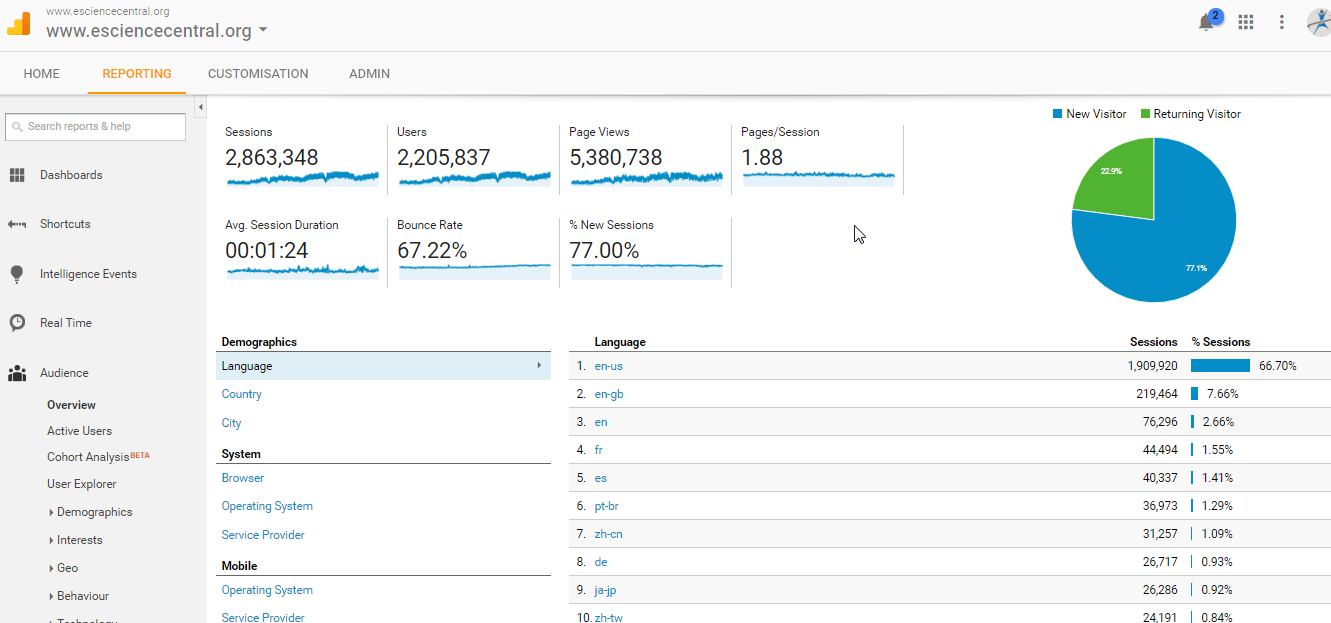
A statistical representation of global users for www.esciencecentral.org (Source: Google Analytics)
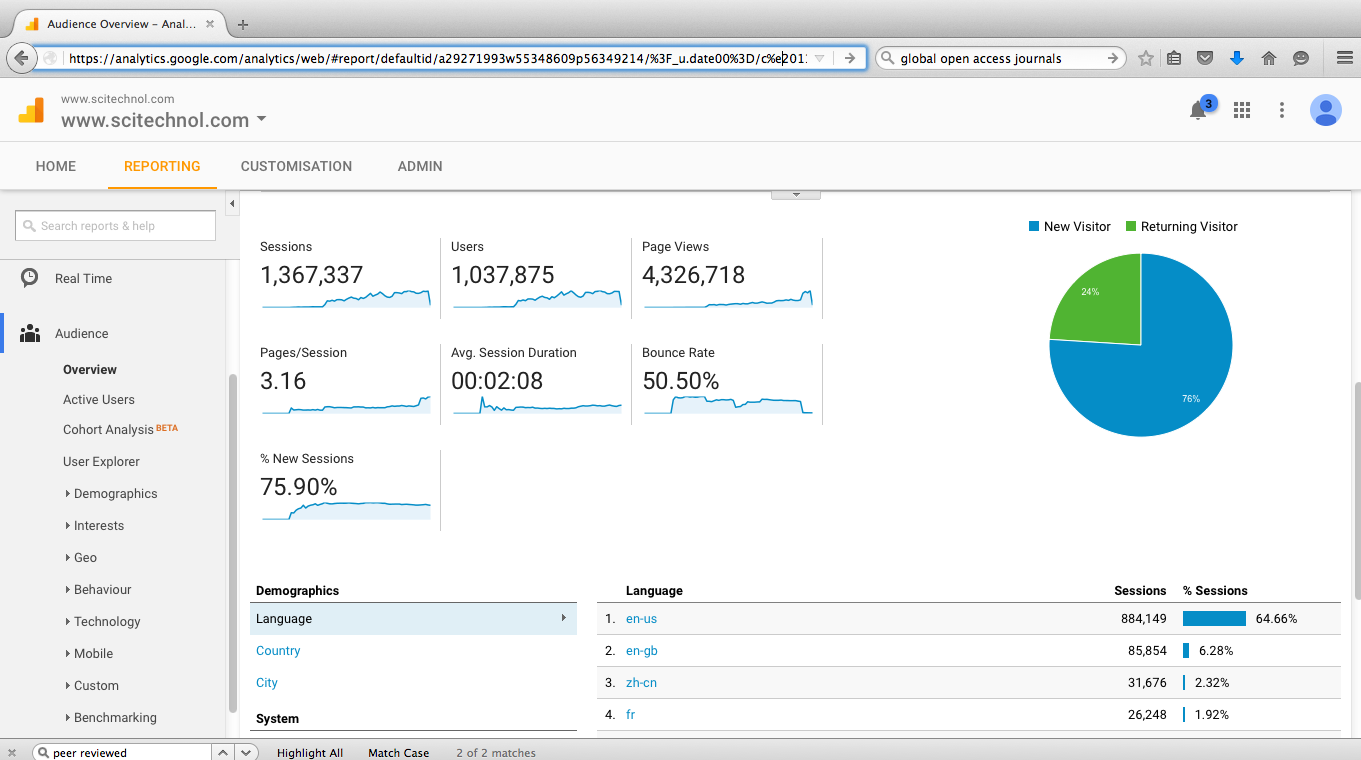
A statistical representation of global users for www.scitechnol.com (Source: Google Analytics)
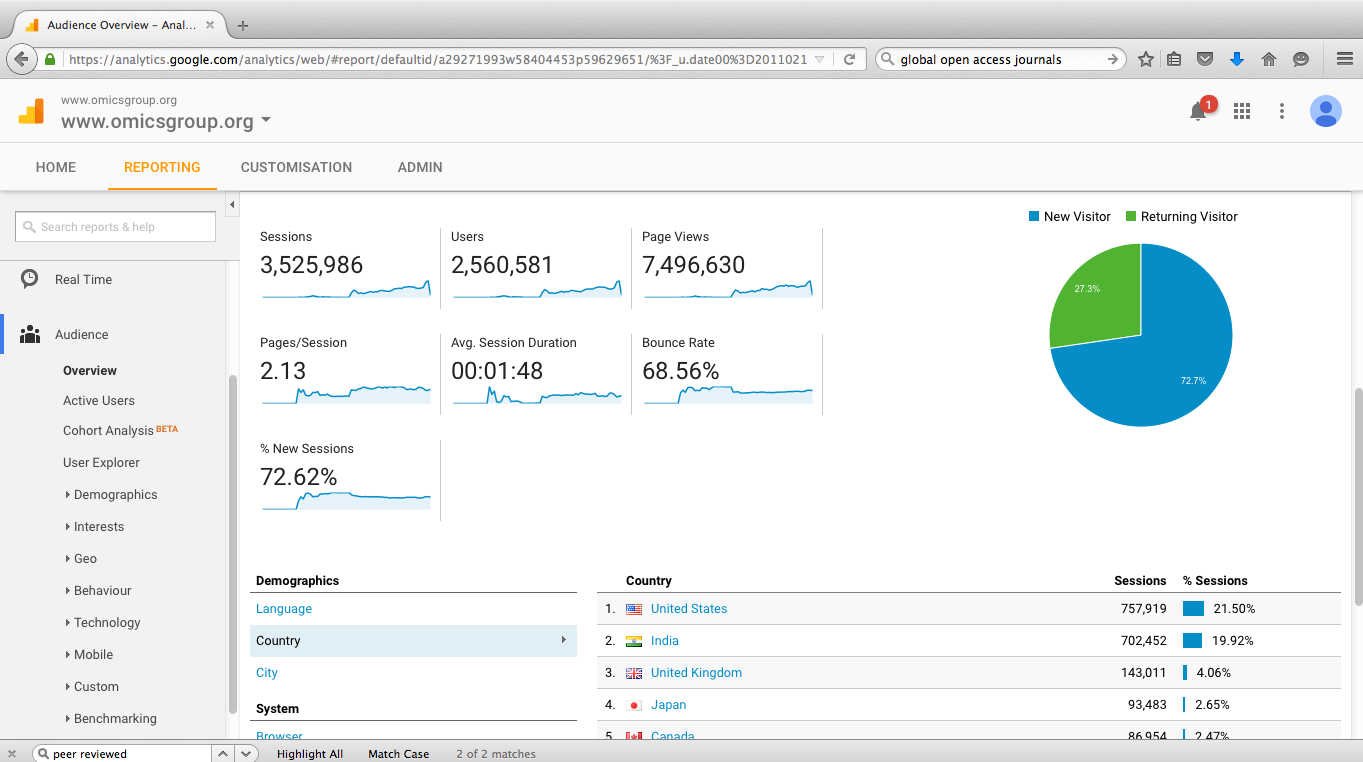
A statistical representation of global users for www.omicsgroup.org (Source: Google Analytics)

A statistical representation of global users for www.conferenceseries.com (Source: Google Analytics)